Data Encodes Stories
type: SaaS || medium: figma, miro
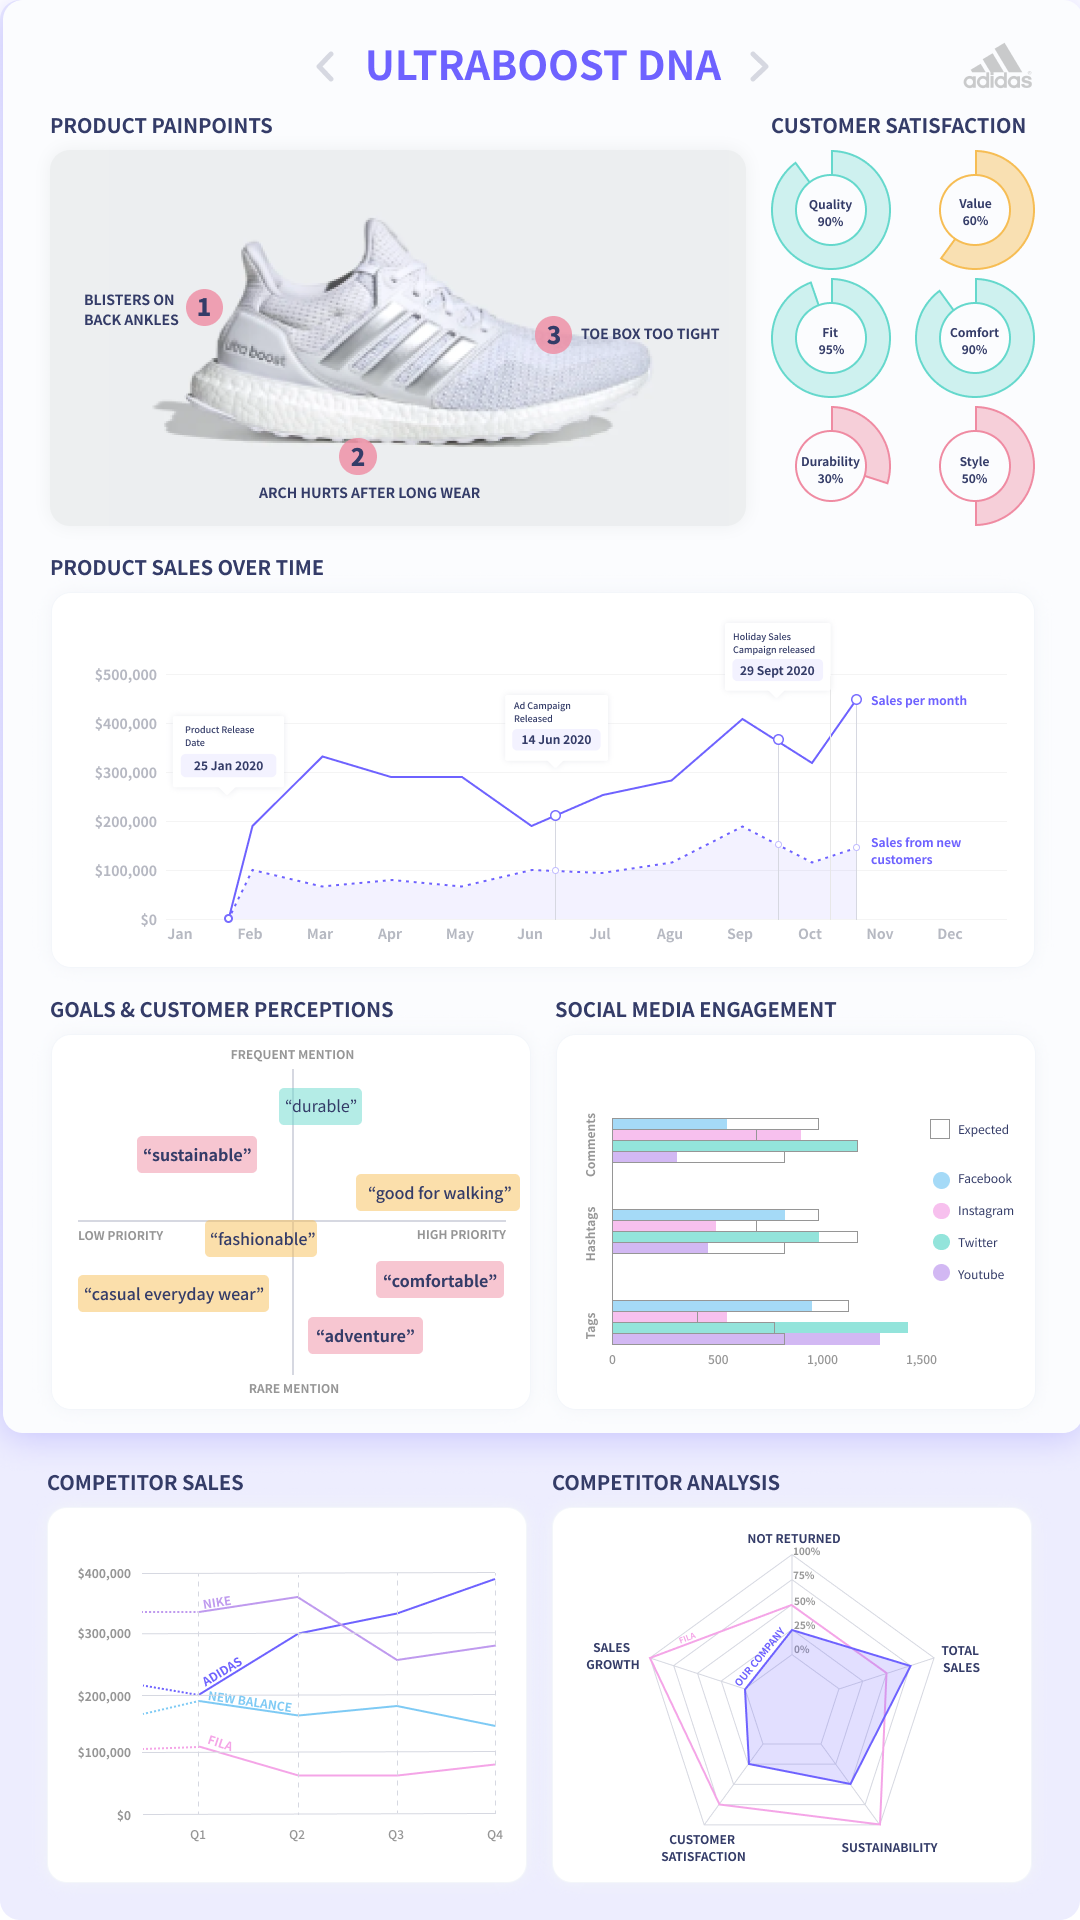
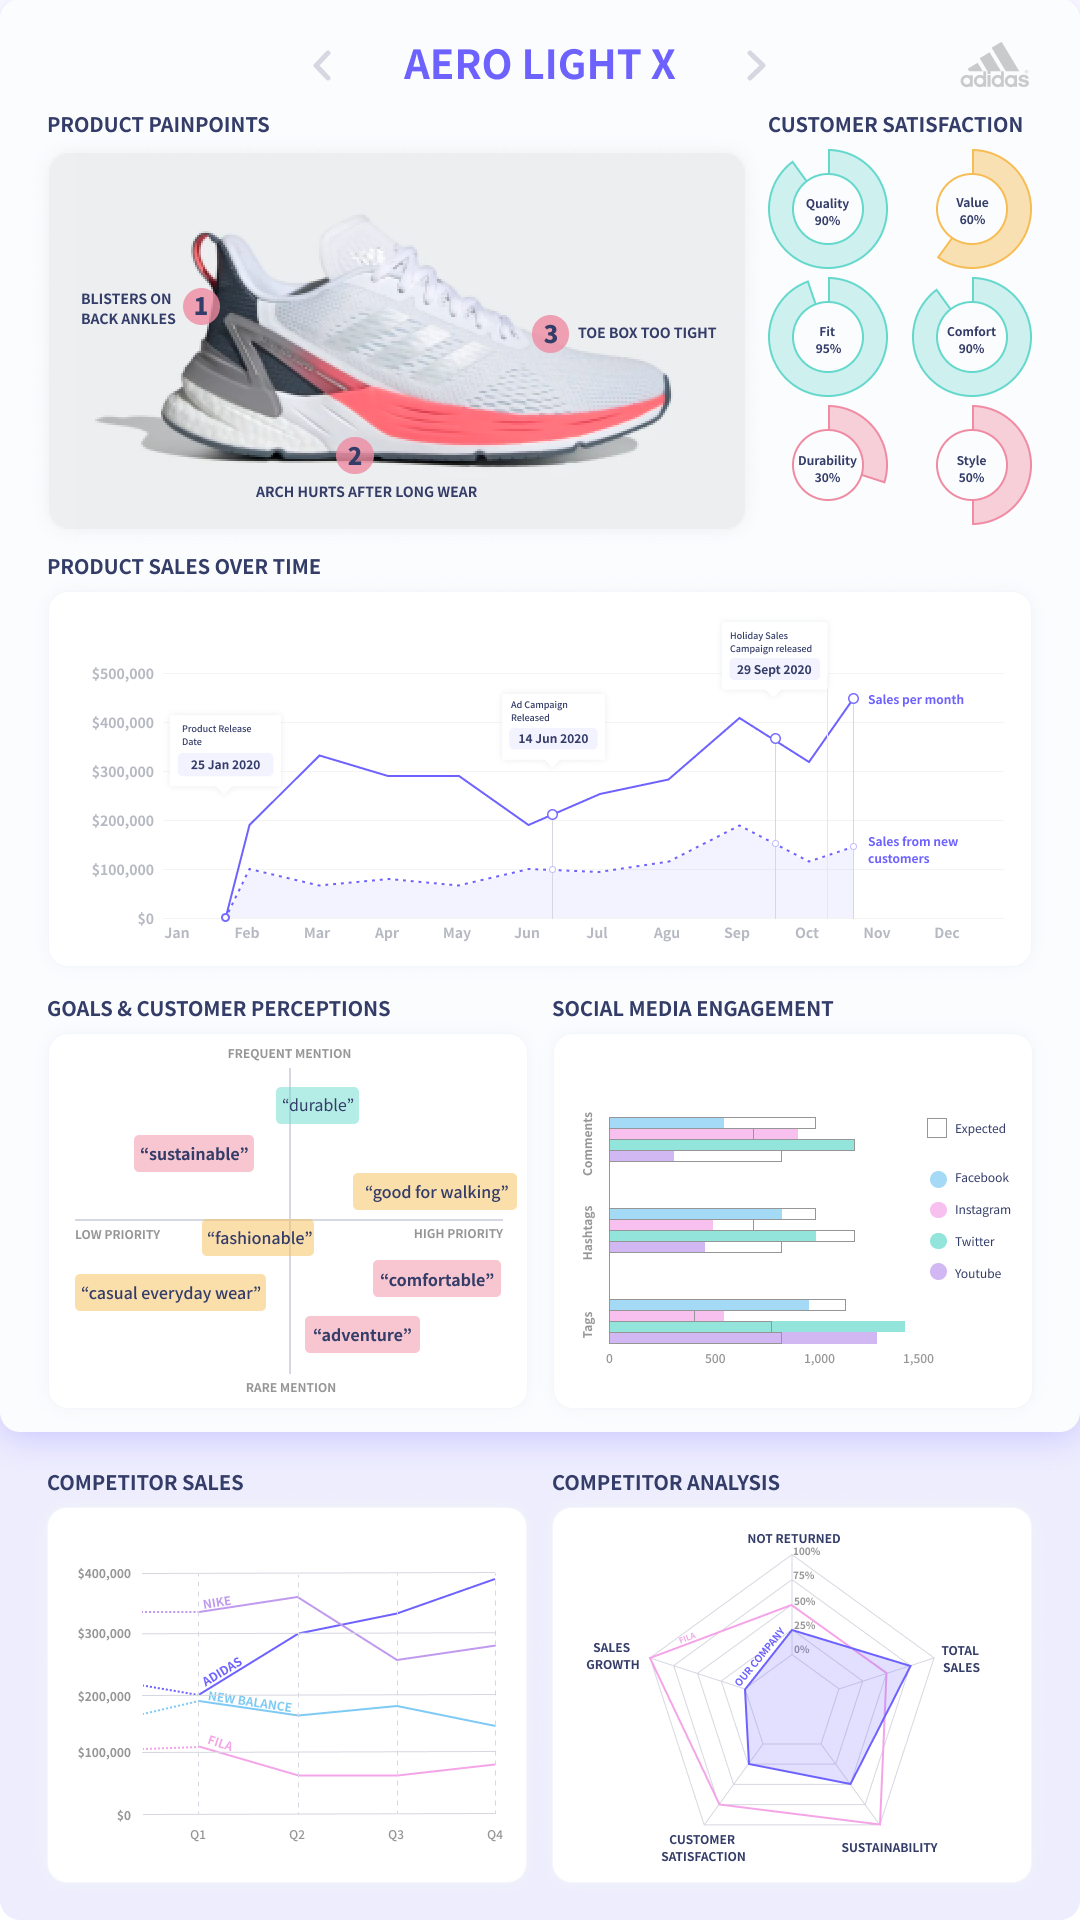
In a team of four, we were tasked to create a dashboard that not only inspired creativity through data but we were also limited to only using one controller to control the dashboard. With this, our team created a dashboard that provided actionable data for the designers using it.
process book
problem space
-
We were given personas that are all designers of a shoe company. They needed a way to view data that could inspire new and innovative designs. The current data provided are through unfiltered spreadsheets with missing information in many columns.
-
How might we design for [which persona] where elements in our dashboard can inspire them and fulfill their wants?
-
We chose to select a small handful of pain points that we can collect from customer feedback. These pain points would be live and designers can see movement as they view the dashboard.
personas
solution
We selected from a large assortment of possible data points to use and settled on the following:
Product Pain-points
Customer Satisfaction
Product Sales-Over-Time
Goals and Customer Perceptions
Social Media Engagement
Competitor Sales
Competitor Analysis
We selected these to best cater to the preferences of the three personas.
Everything except for the competitor information would change based on each shoe, and the control we selected was simple left and right buttons. The final design is a vertical dashboard hosted in any office or meeting room to provide data for brainstorming sessions.


